IELTS Task 1 Masterclass: Food Price Index
Score: 0/8
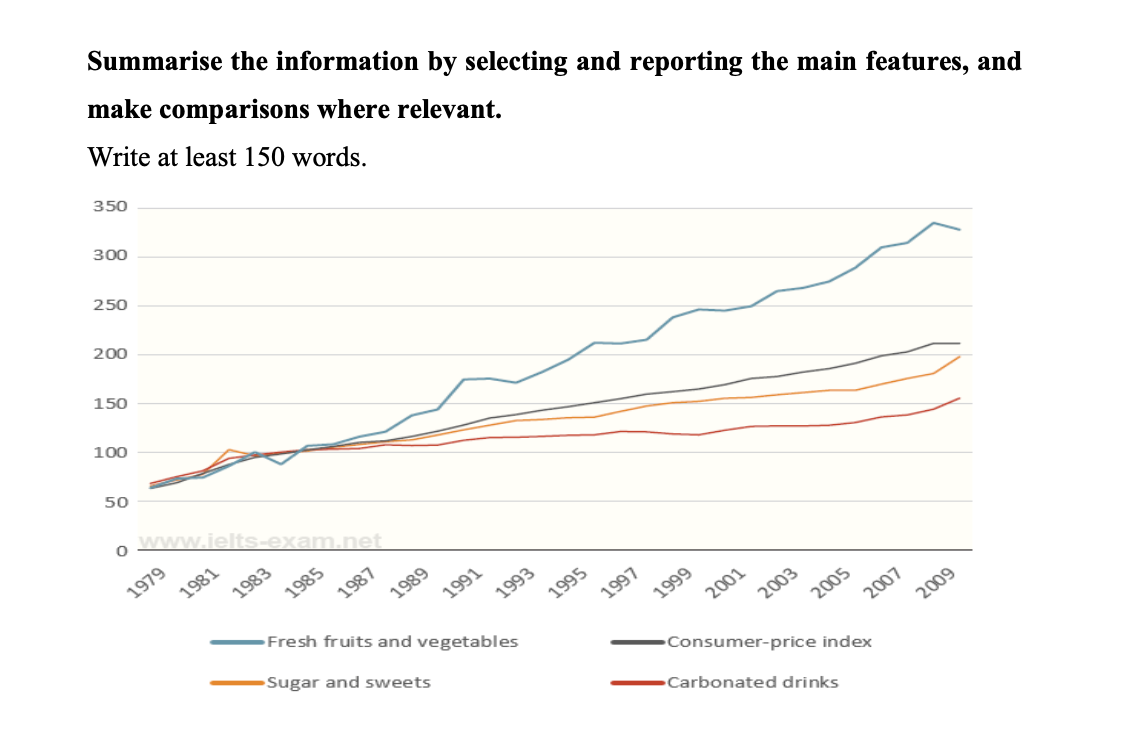
The line graph provides information about changes in price in the USA of three different food product groups from 1979 to 2009, and the overall trend in the consumer price index over this 30-year period.
Overall, it is clear that prices for the three food product groups, despite fluctuations. Only the increase in the prices for fresh fruits and vegetables was significantly than the rise in the general consumer price index.
All the lines on the graph have the starting figure in 1979. Over the period, the consumer price index steadily from around 60 in 1979 to over 200 in 2009. Prices for sugar and sweets and carbonated drinks showed similar trends. Although their prices also rose, they were consistently the consumer price index average after 1987. After many minor fluctuations, the number for sugar and sweets was 200 on the graph in 2009, than the final figure for carbonated drinks at 150.
Prices for fresh fruits and vegetables, particularly after 1989. From the same figure of about 60 at the start of the period, the prices finished at roughly 330 on the index in 2009.
🚀 5 Band 9 Structures & Vocabulary
Trạng từ Rose steadily: Tăng trưởng một cách ổn định, đều đặn qua thời gian (Thay cho “increased”).
Cấu trúc Despite fluctuations: Mặc dù có những sự biến động (Cách mô tả xu hướng tăng/giảm nhưng không thẳng tắp).
So sánh Significantly higher than: Cao hơn đáng kể so với… (Dùng để nhấn mạnh sự chênh lệch lớn).
Trạng từ Consistently below: Luôn nằm dưới mức… (Cách mô tả vị trí của đường đồ thị so với đường trung bình).
Trạng từ Rose sharply: Tăng trưởng cực mạnh và nhanh (Dùng cho những đoạn dốc đứng của biểu đồ).

Leave a Reply