IELTS Task 1 Intensive: Oil Production Trends
Score: 0/8
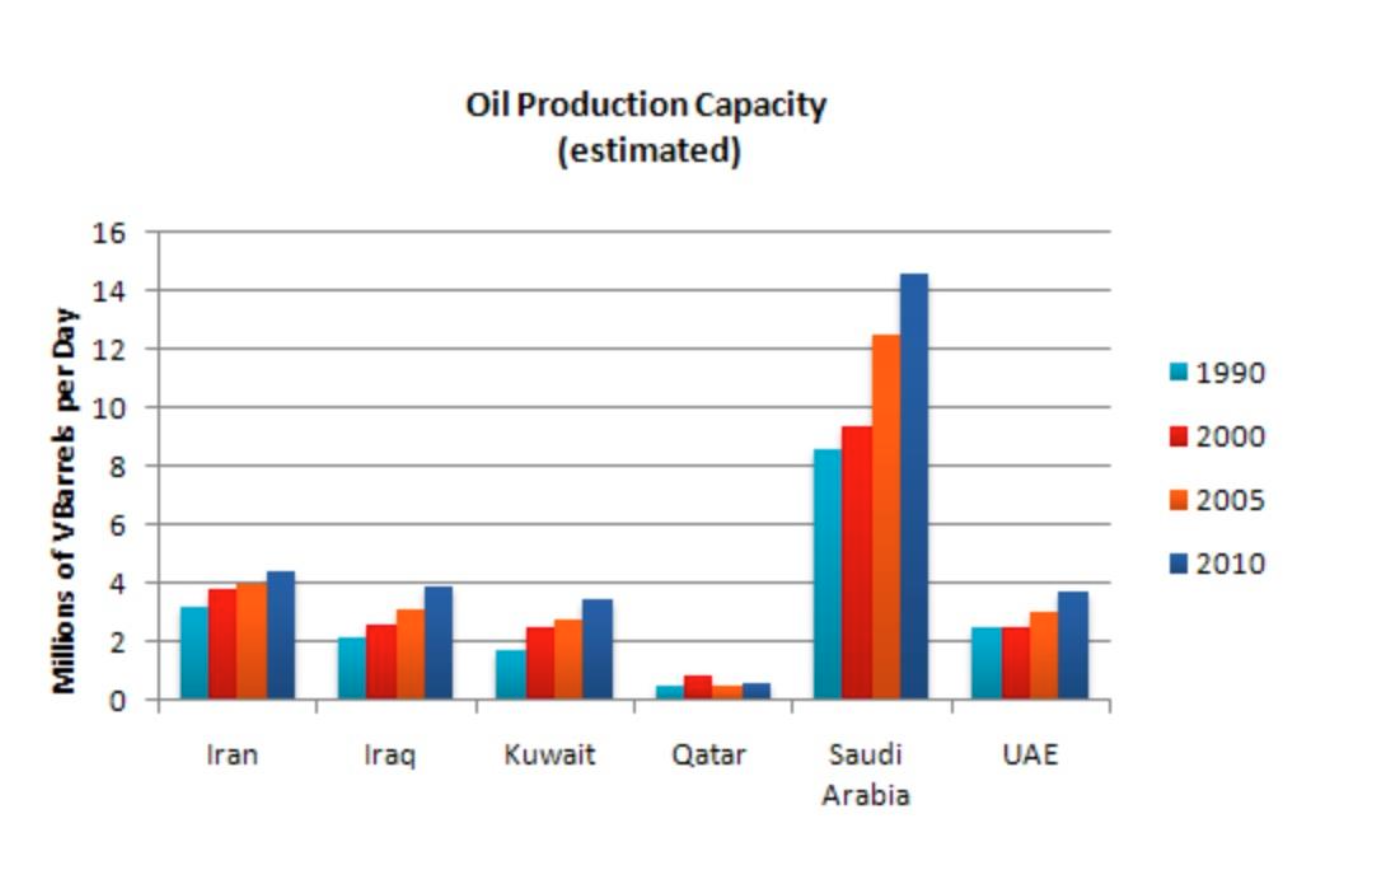
The bar chart illustrates the estimated amount of oil produced in 6 countries between 1990 and 2010.
Overall, oil production capacity during this 20-year period. The figures for Saudi Arabia were than in the other countries, while production was lowest in Qatar.
From 1990 to 2010, there was a significant increase in oil production in Saudi Arabia. In 1990, 8 million barrels per day were produced and this , of over 14 million barrels per day in 2010. In contrast, the smallest producer was Qatar. Despite a slight increase in 2000, production in Qatar at less than 1 million barrels per day.
The other countries saw a in oil production over the period. Although production did not increase in 2000 in the UAE, the amount of oil produced peaked in 2010 in Iran at over 4 million barrels and at 4 million barrels in Iraq, Kuwait and the UAE.
💎 5 Band 9 Structures & Vocabulary
Cấu trúc Tended to increase: Có xu hướng tăng (Cách dùng “tend to” giúp Overview khách quan và chuyên nghiệp hơn).
Ước tính Just over / Almost: Hơn một chút / Gần bằng (Cực kỳ quan trọng để mô tả số liệu không tròn trịa trong biểu đồ cột).
Trạng từ Significantly higher: Cao hơn đáng kể (Ghi điểm Lexical Resource khi mô tả sự chênh lệch lớn).
Cấu trúc Reaching a peak of: Đạt tới mức đỉnh điểm là… (Dùng mệnh đề V-ing để nối câu mượt mà).
Xu hướng Remained relatively stable: Duy trì ở mức tương đối ổn định (Mô tả trạng thái ít biến động).


Leave a Reply