IELTS Task 1 Masterclass: Food Price Index
Score: 0/6
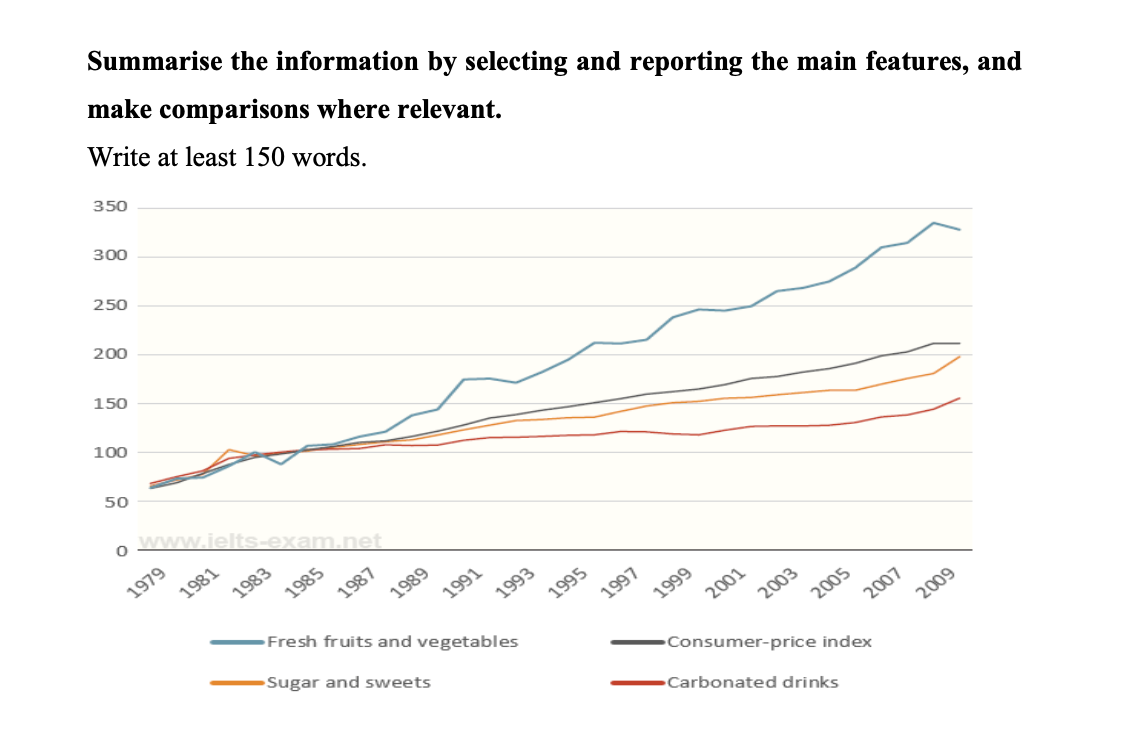
The line graph provides information about changes in price in the USA of three different food product groups from 1979 to 2009.
Overall, it is clear that prices for the three food product groups, . Only the increase in the prices for fresh fruits and vegetables was than the rise in the general consumer price index.
Over the period, the consumer price index from around 60 in 1979 to over 200 in 2009. Prices for sugar and sweets and carbonated drinks showed .
Prices for fresh fruits and vegetables, particularly after 1989. From the same figure of about 60 at the start of the period, the prices finished at roughly 330 on the index in 2009.
💎 5 Band 9 Structures & Vocabulary
Trạng từ Rose steadily / sharply: Mô tả mức độ tăng ổn định hoặc tăng vọt (Yếu tố ghi điểm tiêu chí Lexical Resource).
Cấu trúc Despite fluctuations: Mặc dù có những biến động (Cách dùng cực hay trong Overview để bao quát xu hướng tăng/giảm chung).
So sánh Significantly higher than: Cao hơn đáng kể so với… (Dùng để nhấn mạnh sự chênh lệch lớn giữa các nhóm dữ liệu).
Cấu trúc Showed similar trends: Cho thấy những xu hướng tương tự (Dùng để nhóm các đối tượng có biểu đồ giống nhau).
Ngữ pháp Finished at roughly…: Kết thúc tại mức xấp xỉ… (Mô tả điểm cuối của biểu đồ đường một cách chuyên nghiệp).

Leave a Reply