IELTS Task 1: CO2 Emissions & Vehicle Usage
Score: 0/9
Diagram: Emission Data & Forecast
CO2 Emissions and Number of Vehicles (2000-2020)
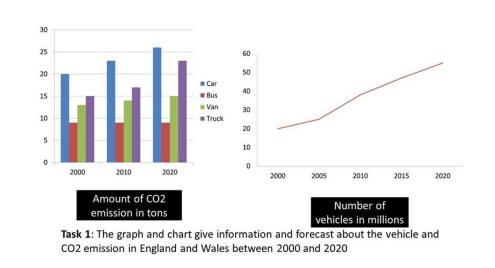
The bar chart the amount of CO2 emissions produced by four types of vehicles. The line graph shows the number of vehicles.
Overall, the chart indicates a in the emission of CO2 from cars, vans and trucks. The graph shows that the number of vehicles on the road is expected to continue to increase .
In 2000, CO2 emissions from cars was the figure at 20 tons. The emissions from trucks and vans was similar, at 15 and 13 tons , whereas the emissions from buses totalled 9 tons.
By 2020, a rise in car emissions to over 25 tons of CO2 is . In contrast, the figure for CO2 emissions from buses will continue to be the lowest amount, remaining at 9 tons.
The number of road vehicles was 20 million in 2000. This increased to 50 million by 2015 and is expected to increase to 55 million by 2020.
• Forecast: Được dự báo (cho tương lai).
• Respectively: Lần lượt là (theo thứ tự).
• Remain stable: Giữ ở mức ổn định.
• Sharply/Rapidly: Một cách nhanh chóng/mạnh mẽ.

Leave a Reply