IELTS Task 1: Edmonton Transport Analysis
Score: 0/9
Pie Chart & Table: Transport Modes and Car Use
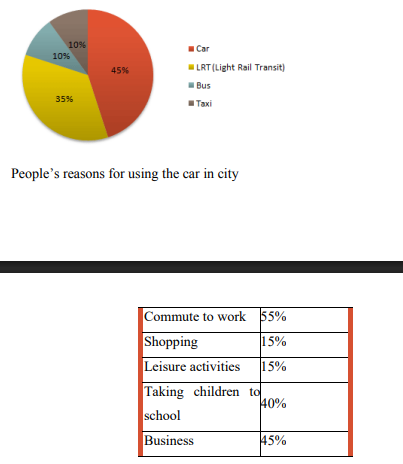
The pie chart shows four modes of transport in Edmonton and the percentage use of each by people living in the city. The table the reasons why the residents of Edmonton use their cars.
Overall, cars are used in to other means of transport. The reason why people use their cars in the city is commuting to work.
It is clear from the percentages shown in the pie chart, that travel by car is the highest figure, at . This is followed by at 35%, while travel by bus or taxi each represent only .
The table compares five reasons why people use their cars. The reasons given relate mainly to work, with a figure of 55% for commuting and 45% for . However, taking to school is also high on the list, at 40%.
Using the car for is recorded at 15% and the same figure is given for activities.
• In preference to: Ưu tiên hơn so với…
• Principal reason: Lý do chính/quan trọng nhất.
• Commuting: Đi làm hàng ngày.
• Represent: Tương ứng với/chiếm (số liệu).

Leave a Reply