IELTS Task 1: Household Expenditure
Score: 0/7
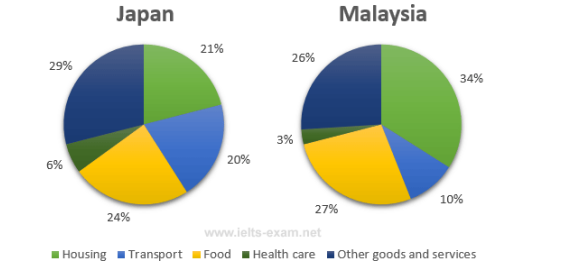
The charts the average household spending in Japan and Malaysia in terms of five important categories in 2010.
Overall, it is clear that householders in countries spent the largest proportion of their income on just three categories – housing, food and other goods and services. The percentage figures for spending on transport and healthcare in Japan were those for Malaysia.
In Malaysian households, the highest category was , which represented 34% of the total expenditure. Whereas this was higher than in Japan, with just 21% spent on housing, Japanese householders spent the highest proportion on a range of , at 29%.
In terms of food, the figures for both countries were similar, at 27% and 24% for Malaysia and Japan .
Expenditure on was the lowest category. In Japan, this accounted for 6% of the total, while 20% of household spending went on transport. These figures were exactly those shown for Malaysia.
🚀 5 Band 9 Structures & Vocabulary
Từ vựng Expenditure: Danh từ cực hay thay thế cho “spending” (mức chi tiêu).
Cấu trúc Accounted for [X%]: Cấu trúc kinh điển để nói về việc chiếm bao nhiêu phần trăm.
So sánh Double those for [Country]: Cách so sánh gấp đôi ngắn gọn mà cực kỳ hiệu quả (Gấp đôi số liệu của…).
Từ nối Whereas: Dùng để nối hai vế đối lập trong cùng một câu, giúp tăng điểm Grammatical Range.
Cấu trúc Respectively: Luôn dùng ở cuối câu khi liệt kê số liệu tương ứng cho các đối tượng đã nêu.

Leave a Reply