Tri Duc English
Excellence in Education
IELTS Writing Task 1: CO2 Emissions & Vehicle Numbers
Sử dụng dữ liệu từ biểu đồ cột và đường để hoàn thành bài báo cáo Band 9.
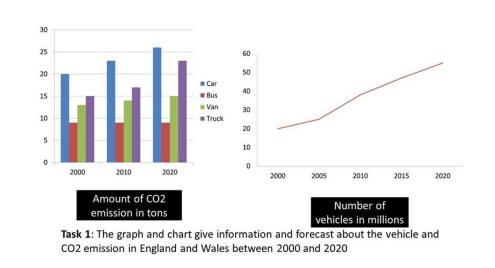
[Biểu đồ khí thải CO2 và số lượng xe tại Anh & Wales 2000-2020]
The bar chart the amount of CO2 emissions produced by four types of vehicles. The line graph shows the number of vehicles.
Overall, the chart indicates a in the emission of CO2 from cars, vans and trucks. The graph shows that the number of vehicles on the road is expected to continue to increase .
In 2000, CO2 emissions from cars was the figure at 20 tons. The emissions from trucks and vans was similar, at 15 and 13 tons , whereas the emissions from buses totalled 9 tons.
By 2020, a rise in car emissions to over 25 tons of CO2 is . In contrast, the figure for CO2 emissions from buses will continue to be the lowest amount, remaining at 9 tons.
The number of road vehicles was 20 million in 2000. This increased to 50 million by 2015 and is expected to increase to 55 million by 2020.
Từ vựng hữu ích (Useful Vocabulary)
– Forecast / Predicted: Được dự báo/dự đoán (dùng cho mốc thời gian tương lai).
– Sharply / Rapidly: Một cách mạnh mẽ/nhanh chóng.
– Remain stable: Giữ ở mức ổn định, không thay đổi.
– Respectively: Lần lượt theo thứ tự đã nêu tên ở trước.
Tri Duc English Center
© 2026 All Rights Reserved.


Leave a Reply